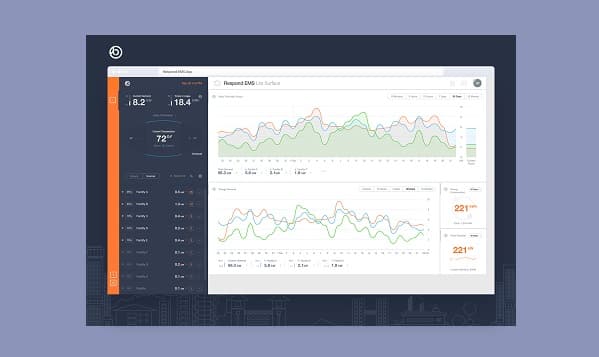
Brighterlink Dashboard
Advanced visualization dashboard for monitoring and optimizing solar energy consumption.
Energy2018Web
AngularNode
Key Challenge
Visualizing complex, multi-source solar energy data into actionable insights for end-users.
Our Approach & Solution
Engineered an Angular dashboard with real-time data visualization and predictive analytics for energy forecasting.
Technology Deep Dive
A strategic selection of technologies was used to ensure long-term stability and high performance:
Data Viz
Custom D3.js and Angular components for high-fidelity energy charts.
API
Node.js REST API designed for high-frequency IoT data ingestion.
Results
- 15% reduction in energy waste through increased user awareness
- Seamless integration with hardware monitoring systems
- Scalable to thousands of energy nodes
Facing a similar challenge?
Tell us about your project and we'll come back with a clear technical plan.